-
CORE FRAMEWORK
FEATURED COMPONENTS
-
RESOURCES
-
LEARN ZK
RESOURCES
First time here? Check out the FAQ!
Hello,
I got a chart that is filled with a CategoryModel and when I want to reload it with only some data, the chart legend is not cleaned and it shows the previous chart legend. First it is shown correctly:
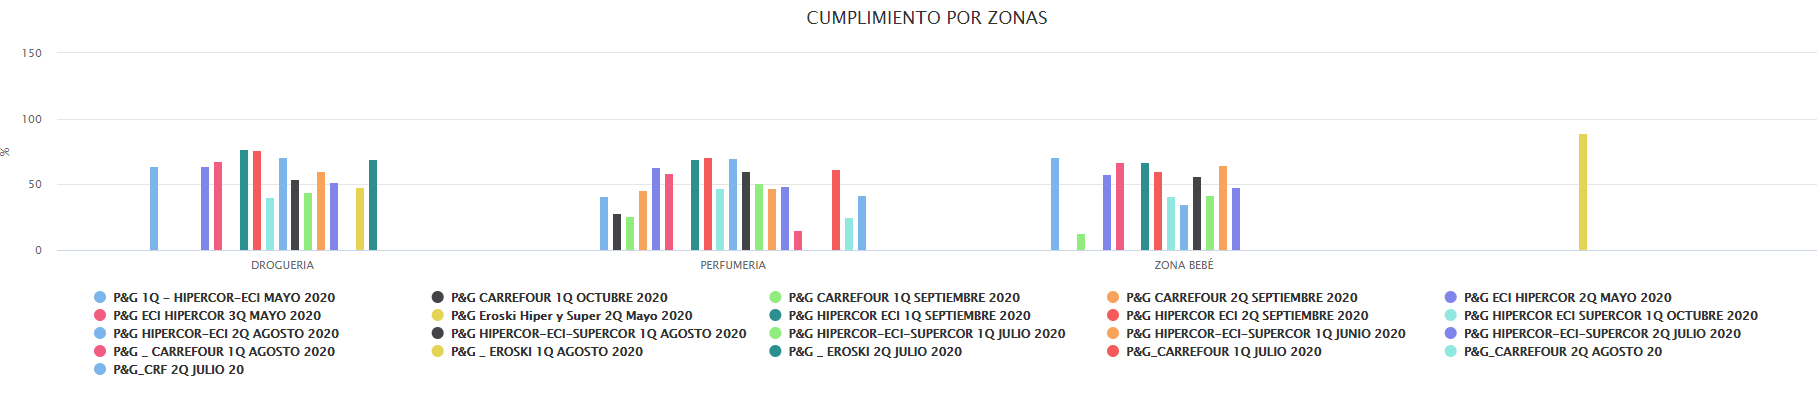
And then, if I reload the chart only with the data whose legend is marked in red:

It shows all the previous legend. What I have:
.zul:
<charts id="chartCumplimientosZonas" type="column" model="@bind(vm.modelCumpliZonas)"/>
.java:
private Charts chartCumplimientosZonas;
private CategoryModel modelCumpliZonas;

modelCumpliZonas = getModelCumpliZonas(); //Load data
chartCumplimientosZonas.setModel(modelCumpliZonas);
chartCumplimientosZonas.getXAxis().setCrosshair(true);
chartCumplimientosZonas.getTooltip().setPointFormat("{series.name}: <b>{point.y:.1f}%</b>");
chartCumplimientosZonas.getYAxis().getTitle().setText("%");
chartCumplimientosZonas.getYAxis().setMax(105);
chartCumplimientosZonas.getYAxis().setMin(0);
chartCumplimientosZonas.getPlotOptions().getBar().getDataLabels().setEnabled(true);
chartCumplimientosZonas.getCredits().setEnabled(false);
chartCumplimientosZonas.getPlotOptions().getColumn().setPointPadding(0.2);;
chartCumplimientosZonas.getPlotOptions().getColumn().setBorderWidth(0);
chartCumplimientosZonas.getExporting().setEnabled(opcionesGraficos);
chartCumplimientosZonas.setWidth(null);
chartCumplimientoZonas.getModel() has these values:
All data:
categoryList: [DROGUERIA, PERFUMERIA, ZONA BEBÉ, ] seriesList: [P&G 1Q - HIPERCOR-ECI MAYO 2020, P&G CARREFOUR 1Q OCTUBRE 2020, P&G CARREFOUR 1Q SEPTIEMBRE 2020, P&G CARREFOUR 2Q SEPTIEMBRE 2020, P&G ECI HIPERCOR 2Q MAYO 2020, P&G ECI HIPERCOR 3Q MAYO 2020, P&G Eroski Hiper y Super 2Q Mayo 2020, P&G HIPERCOR ECI 1Q SEPTIEMBRE 2020, P&G HIPERCOR ECI 2Q SEPTIEMBRE 2020, P&G HIPERCOR ECI SUPERCOR 1Q OCTUBRE 2020, P&G HIPERCOR-ECI 2Q AGOSTO 2020, P&G HIPERCOR-ECI-SUPERCOR 1Q AGOSTO 2020, P&G HIPERCOR-ECI-SUPERCOR 1Q JULIO 2020, P&G HIPERCOR-ECI-SUPERCOR 1Q JUNIO 2020, P&G HIPERCOR-ECI-SUPERCOR 2Q JULIO 2020, P&G _ CARREFOUR 1Q AGOSTO 2020, P&G _ EROSKI 1Q AGOSTO 2020, P&G _ EROSKI 2Q JULIO 2020, P&GCARREFOUR 1Q JULIO 2020, P&GCARREFOUR 2Q AGOSTO 20, P&GCRF 2Q JULIO 20] seriesMap: {P&G CARREFOUR 1Q OCTUBRE 2020=[PERFUMERIA], P&G HIPERCOR-ECI 2Q AGOSTO 2020=[DROGUERIA, PERFUMERIA, ZONA BEBÉ], P&G _ CARREFOUR 1Q AGOSTO 2020=[PERFUMERIA], P&GCARREFOUR 2Q AGOSTO 20=[PERFUMERIA], P&G HIPERCOR ECI 1Q SEPTIEMBRE 2020=[DROGUERIA, PERFUMERIA, ZONA BEBÉ], P&G ECI HIPERCOR 3Q MAYO 2020=[DROGUERIA, PERFUMERIA, ZONA BEBÉ], P&G Eroski Hiper y Super 2Q Mayo 2020=[], P&G CARREFOUR 2Q SEPTIEMBRE 2020=[PERFUMERIA], P&GCARREFOUR 1Q JULIO 2020=[PERFUMERIA], P&G ECI HIPERCOR 2Q MAYO 2020=[DROGUERIA, PERFUMERIA, ZONA BEBÉ], P&G HIPERCOR-ECI-SUPERCOR 1Q JULIO 2020=[DROGUERIA, PERFUMERIA, ZONA BEBÉ], P&G HIPERCOR ECI SUPERCOR 1Q OCTUBRE 2020=[DROGUERIA, PERFUMERIA, ZONA BEBÉ], P&G _ EROSKI 1Q AGOSTO 2020=[DROGUERIA], P&G _ EROSKI 2Q JULIO 2020=[DROGUERIA], P&G HIPERCOR ECI 2Q SEPTIEMBRE 2020=[DROGUERIA, PERFUMERIA, ZONA BEBÉ], P&G 1Q - HIPERCOR-ECI MAYO 2020=[DROGUERIA, PERFUMERIA, ZONA BEBÉ], P&G HIPERCOR-ECI-SUPERCOR 1Q AGOSTO 2020=[DROGUERIA, PERFUMERIA, ZONA BEBÉ], P&GCRF 2Q JULIO 20=[PERFUMERIA], P&G CARREFOUR 1Q SEPTIEMBRE 2020=[PERFUMERIA, ZONA BEBÉ], P&G HIPERCOR-ECI-SUPERCOR 2Q JULIO 2020=[DROGUERIA, PERFUMERIA, ZONA BEBÉ], P&G HIPERCOR-ECI-SUPERCOR 1Q JUNIO 2020=[DROGUERIA, PERFUMERIA, ZONA BEBÉ]} valueMap: {[P&G 1Q - HIPERCOR-ECI MAYO 2020, DROGUERIA]=64.0, [P&G 1Q - HIPERCOR-ECI MAYO 2020, PERFUMERIA]=41.0, [P&G 1Q - HIPERCOR-ECI MAYO 2020, ZONA BEBÉ]=71.0, [P&G CARREFOUR 1Q OCTUBRE 2020, PERFUMERIA]=28.0, [P&G CARREFOUR 1Q SEPTIEMBRE 2020, PERFUMERIA]=26.0, [P&G CARREFOUR 1Q SEPTIEMBRE 2020, ZONA BEBÉ]=13.0, [P&G CARREFOUR 2Q SEPTIEMBRE 2020, PERFUMERIA]=46.0, [P&G ECI HIPERCOR 2Q MAYO 2020, DROGUERIA]=64.0, [P&G ECI HIPERCOR 2Q MAYO 2020, PERFUMERIA]=63.0, [P&G ECI HIPERCOR 2Q MAYO 2020, ZONA BEBÉ]=58.0, [P&G ECI HIPERCOR 3Q MAYO 2020, DROGUERIA]=68.0, [P&G ECI HIPERCOR 3Q MAYO 2020, PERFUMERIA]=59.0, [P&G ECI HIPERCOR 3Q MAYO 2020, ZONA BEBÉ]=67.0, [P&G Eroski Hiper y Super 2Q Mayo 2020, ]=89.0, [P&G HIPERCOR ECI 1Q SEPTIEMBRE 2020, DROGUERIA]=77.0, [P&G HIPERCOR ECI 1Q SEPTIEMBRE 2020, PERFUMERIA]=69.0, [P&G HIPERCOR ECI 1Q SEPTIEMBRE 2020, ZONA BEBÉ]=67.0, [P&G HIPERCOR ECI 2Q SEPTIEMBRE 2020, DROGUERIA]=76.0, [P&G HIPERCOR ECI 2Q SEPTIEMBRE 2020, PERFUMERIA]=71.0, [P&G HIPERCOR ECI 2Q SEPTIEMBRE 2020, ZONA BEBÉ]=60.0, [P&G HIPERCOR ECI SUPERCOR 1Q OCTUBRE 2020, DROGUERIA]=40.0, [P&G HIPERCOR ECI SUPERCOR 1Q OCTUBRE 2020, PERFUMERIA]=47.0, [P&G HIPERCOR ECI SUPERCOR 1Q OCTUBRE 2020, ZONA BEBÉ]=41.0, [P&G HIPERCOR-ECI 2Q AGOSTO 2020, DROGUERIA]=71.0, [P&G HIPERCOR-ECI 2Q AGOSTO 2020, PERFUMERIA]=70.0, [P&G HIPERCOR-ECI 2Q AGOSTO 2020, ZONA BEBÉ]=35.0, [P&G HIPERCOR-ECI-SUPERCOR 1Q AGOSTO 2020, DROGUERIA]=54.0, [P&G HIPERCOR-ECI-SUPERCOR 1Q AGOSTO 2020, PERFUMERIA]=60.0, [P&G HIPERCOR-ECI-SUPERCOR 1Q AGOSTO 2020, ZONA BEBÉ]=56.0, [P&G HIPERCOR-ECI-SUPERCOR 1Q JULIO 2020, DROGUERIA]=44.0, [P&G HIPERCOR-ECI-SUPERCOR 1Q JULIO 2020, PERFUMERIA]=51.0, [P&G HIPERCOR-ECI-SUPERCOR 1Q JULIO 2020, ZONA BEBÉ]=42.0, [P&G HIPERCOR-ECI-SUPERCOR 1Q JUNIO 2020, DROGUERIA]=60.0, [P&G HIPERCOR-ECI-SUPERCOR 1Q JUNIO 2020, PERFUMERIA]=47.0, [P&G HIPERCOR-ECI-SUPERCOR 1Q JUNIO 2020, ZONA BEBÉ]=65.0, [P&G HIPERCOR-ECI-SUPERCOR 2Q JULIO 2020, DROGUERIA]=52.0, [P&G HIPERCOR-ECI-SUPERCOR 2Q JULIO 2020, PERFUMERIA]=49.0, [P&G HIPERCOR-ECI-SUPERCOR 2Q JULIO 2020, ZONA BEBÉ]=48.0, [P&G _ CARREFOUR 1Q AGOSTO 2020, PERFUMERIA]=15.0, [P&G _ EROSKI 1Q AGOSTO 2020, DROGUERIA]=48.0, [P&G _ EROSKI 2Q JULIO 2020, DROGUERIA]=69.0, [P&GCARREFOUR 1Q JULIO 2020, PERFUMERIA]=62.0, [P&GCARREFOUR 2Q AGOSTO 20, PERFUMERIA]=25.0, [P&G_CRF 2Q JULIO 20, PERFUMERIA]=42.0}
New data:
categoryList: [DROGUERIA, PERFUMERIA, ZONA BEBÉ] seriesList: [P&G 1Q - HIPERCOR-ECI MAYO 2020] seriesMap: {P&G 1Q - HIPERCOR-ECI MAYO 2020=[DROGUERIA, PERFUMERIA, ZONA BEBÉ]} valueMap: {[P&G 1Q - HIPERCOR-ECI MAYO 2020, DROGUERIA]=64.0, [P&G 1Q - HIPERCOR-ECI MAYO 2020, PERFUMERIA]=41.0, [P&G 1Q - HIPERCOR-ECI MAYO 2020, ZONA BEBÉ]=71.0}
Why chart legend shows all items instead of only showing P&G 1Q - HIPERCOR-ECI MAYO 2020?
Thank you, Javier
Hi There,
Tested a similar structure on ZKCharts 7.2.1.2 / ZK 9, but couldn't get a reproducing case.
Which ZKCharts / ZK version are you running currently?
A few questions: When you update the model, do you call either @notifyChange or BindUtils.postNotifyChange on the vm.modelCumpliZonas property? Or do you trigger the update in a different way? Do you generate an entirely new model object, or do you update values in the exiting CategoryModel object?
As a workaround, you could try to invalidate the charts component when you change the model content, but I would only do that as last resort, since it's more expensive than just triggering an update.
and finally one (not relevant) nitpick: the charts model="@bind(vm.model)" could be changed for a @load(), since the chart will never send a model to the VM. :D
Hi,
We are running ZKCharts version 7.2.1.1 and ZK version 9.1.0.
When we update the model we generate a new DefaultCategoryModel() like:
model = new DefaultCategoryModel();
//Some process that get data and save it in model
modelCumpliZonas = model;
chartCumplimientosZonas.setModel(modelCumpliZonas);
In this case, should we trigger the update with BindUtils.postNotifyChange(null,null,this,"modelCumpliZonas")?
I tried to replace
chartCumplimientosZonas.setModel(modelCumpliZonas)
with
BindUtils.postNotifyChange(null,null,this,"modelCumpliZonas")
But I got the same comportament.
I also tried chartCumplimientosZonas.invalidate(); before create a new model object but nothing changed.
Thank you,
Javier
Hi Javier,
Based on the description, it sounds like the charts component still sends a lot of series data to the client, when it should only send the one serie that exists in your 2nd dataset.
To confirm this, you should check the network panel in the browser's developer tools, and check the zkau request/response containing the update to the charts.
You should see something like:
{"rs":[["outer",[{$u:'yourChartUUID'},[
['chart.Charts','UUID',{id:'yourChartId',plotData:{"chart":{"type":"column"},"series":[{"data":[20,null,null,null],"name":"Name1"},{"data":[null,35,null,null],"name":"Name2"}...
If the issue is at client side, you should only see the single series name (the one containing values in your screen)
in that case, you may want to post a bug with the official ZK support
If the issue is that the configuration for this chart object contains too many entries, you should see data entries for each of the names displayed in the legend.
In that case, you should put a breakpoint in your dataset generation code, to make sure that you are not adding empty series, or series with a name but no data points to the model
Hi,
In the network panel in the browser's developer tools I got this:
['chart.Charts','lJ0Qt',{id:'chartCumplimientosZonas',plotData:{"chart":{"type":"column"},"title":{"text":"CUMPLIMIENTO POR ZONAS"},"series":[{"data":[64.0,41.0,71.0],"name":"P&G 1Q - HIPERCOR-ECI MAYO 2020"},{"data":[],"name":"P&G CARREFOUR 1Q OCTUBRE 2020"},{"data":[],"name":"P&G CARREFOUR 1Q SEPTIEMBRE 2020"},{"data":[],"name":"P&G CARREFOUR 2Q SEPTIEMBRE 2020"},{"data":[],"name":"P&G ECI HIPERCOR 2Q MAYO 2020"},{"data":[],"name":"P&G ECI HIPERCOR 3Q MAYO 2020"},{"data":[],"name":"P&G Eroski Hiper y Super 2Q Mayo 2020"},{"data":[],"name":"P&G HIPERCOR ECI 1Q SEPTIEMBRE 2020"},{"data":[],"name":"P&G HIPERCOR ECI 2Q SEPTIEMBRE 2020"},{"data":[],"name":"P&G HIPERCOR ECI SUPERCOR 1Q OCTUBRE 2020"},{"data":[],"name":"P&G HIPERCOR-ECI 2Q AGOSTO 2020"},{"data":[],"name":"P&G HIPERCOR-ECI-SUPERCOR 1Q AGOSTO 2020"},{"data":[],"name":"P&G HIPERCOR-ECI-SUPERCOR 1Q JULIO 2020"},{"data":[],"name":"P&G HIPERCOR-ECI-SUPERCOR 1Q JUNIO 2020"},{"data":[],"name":"P&G HIPERCOR-ECI-SUPERCOR 2Q JULIO 2020"},{"data":[],"name":"P&G _ CARREFOUR 1Q AGOSTO 2020"},{"data":[],"name":"P&G _ EROSKI 1Q AGOSTO 2020"},{"data":[],"name":"P&G _ EROSKI 2Q JULIO 2020"},{"data":[],"name":"P&G_CARREFOUR 1Q JULIO 2020"},{"data":[],"name":"P&G_CARREFOUR 2Q AGOSTO 20"},{"data":[],"name":"P&G_CRF 2Q JULIO 20"}],"xAxis":[{"categories":["DROGUERIA","PERFUMERIA","ZONA BEBÉ"],"crosshair":{}}],"tooltip":{"pointFormat":"{series.name}: <b>{point.y:.1f}%<\/b>"},"yAxis":[{"title":{"text":"%"},"max":105,"min":0}],"plotOptions":{"bar":{"dataLabels":{"enabled":true}},"column":{"pointPadding":0.2,"borderWidth":0}},"credits":{"enabled":false},"exporting":{"enabled":false}}},{},[]]]]],["outer",[{$u:'lJ0Qv'},[
So I supose that all these series without data are causing this problem. However, I am not adding empty series because I am creating a new Object and the data is the same we can see in the first Post.
Any recommendations? I used setModel and BindUtils.postNotifyChange(null,null,this,"modelCumpliZonas"); and I got the same comportament.
Thank you,
Javier
Hi Javier,
Thanks for the network info, it confirms that the server is in fact sending these empty series. From there we can assume that the issue lies at server side.
Do you have access to the Charts component in your ViewModel? (I see that you are applying settings to charts in Java in your 1st post, but I don't know if that's an extra composer or in a viewModel wiring the component)
Ideally, you should put a breakpoint in the charts class setModel() method and observe what the Charts has as internal series values after the model has been added. From there, you can make sure that the model only contain your expected data.
If that's the case (the model sent to the Charts only contain the single serie you want to display, and the chart ends up containing all of these empty series) you should contact ZK support, send them the full java / zul case to reproduce, and ask if they can find a bug in that workflow.
If the model itself does contain these extra series, then you will need to find out why, most likely at viewModel level.
Somewhat on the late side, but I believe this issue matched this bug ticket fixed in 7.2.2.0: https://tracker.zkoss.org/browse/ZKCHARTS-111
Asked: 2020-11-20 18:49:37 +0800
Seen: 26 times
Last updated: Sep 19 '22


